The American Cancer Society Screening Disparity Atlas is a state-of-the-art dashboard, developed by the American Cancer Society's Geospatial Solutions Team (GST) in collaboration with the Early Detection Team. This new tool provides vital insights into cancer mortality, incidence, demographics, screening and risk factors, enriched with detailed data on Federally Qualified Health Centers (FQHCs), including their associated sites, screening rates, patient characteristics, and informative screening rate charts, spanning from 2014 to 2024. It is a powerful tool that can assist in identifying and addressing gaps to eliminate disparities in cancer screening and outcomes.
Data Sources
Data sources and links are embedded in the Screening Disparity Atlas. On the FQHC popup, you will find a link to the health center's 2024 HRSA profile.
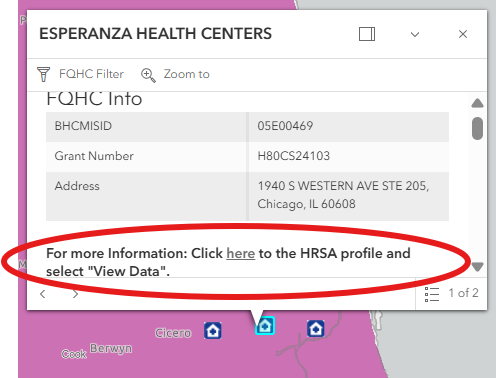
FQHC Popup - HRSA profile
Each map has data sources linked by clicking the ⓘ Info icon found in the upper right of the map window.
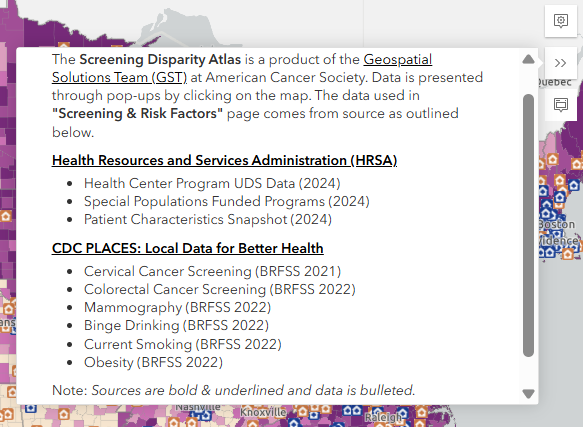
Data Sources Popout
| Source | Map(s) | Description | Data Included |
|---|---|---|---|
| Health Resources and Services Administration (HRSA) Uniform Data System | FQHC(s) data popup on all maps | Data on HRSA supported health centers across the United States, including patient demographics, services provided, and clinical quality measures |
|
| NCI GIS Portal for Cancer Research | Mortality, Incidence | Cancer mortality and incidence rates by cancer type by U.S. County and Territory |
|
| Census American Community Survey (ACS) | Demographics | Data on educational levels (persons aged 25 years and over, languages spoken at home, and poverty status) |
|
| Census Demographic and Housing Characteristics File (DHC) | Demographics | Data on age and sex demographics as well as ta on racial and ethnic composition of the U.S. |
|
| CDC/ATSDR - Place and Health | Demographics | Data on social vulnerability, socioeconomic status, household composition, minority language, housing, and transportation in the U.S. |
|
| CDC PLACES: Local Data for Better Health | Screening & Risk Factors | Screening rates and risk factor prevalence based on data from the Behavioral Risk Factor Surveillance System (BRFSS) |
|
Main Functions
Explore the four interactive choropleth maps for insights into cancer mortality, incidence, demographics, screening & risk factors. Specify different parameters in the query panel. Zoom in and out of the maps and customize the data visualizations to user needs.
Default Map View
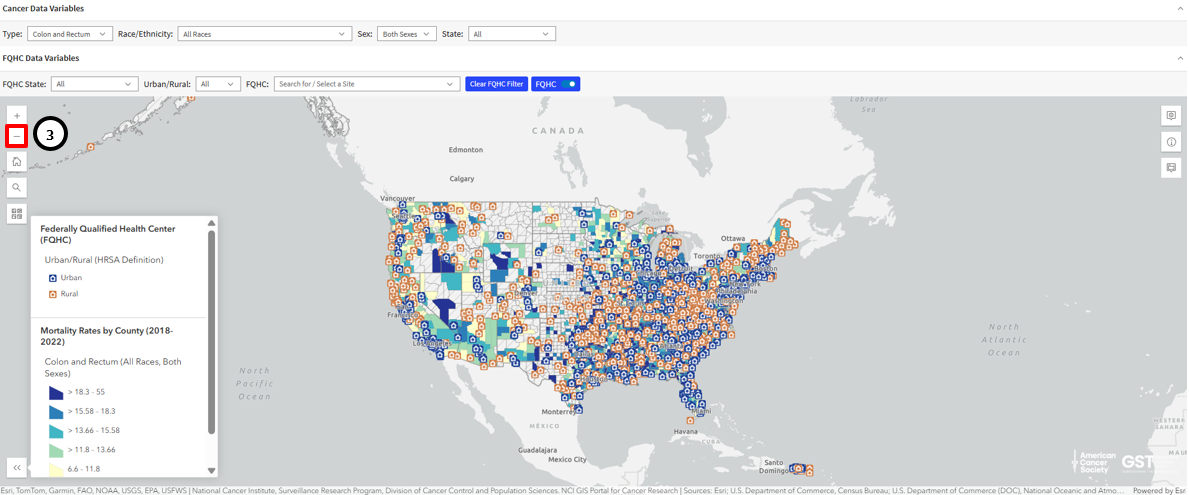
Upon accessing the Atlas, you will be presented with the default map view. From this view, you will see the (1) main map interface, the (2) query panel, (3) legend, and (4) side panel.
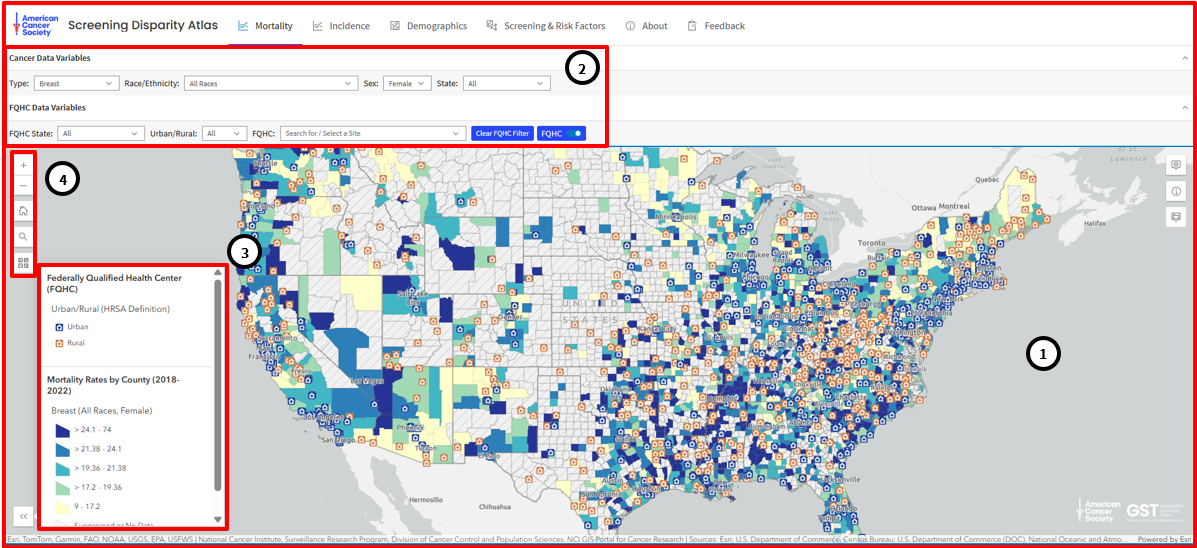
Default Map View
Interactivity and Zooming
Each (1) ![]() symbol represents an FQHC.
Click on any of the
symbol represents an FQHC.
Click on any of the ![]() symbols to be presented
with a popout menu containing data relevant to that specific FQHC.
symbols to be presented
with a popout menu containing data relevant to that specific FQHC.
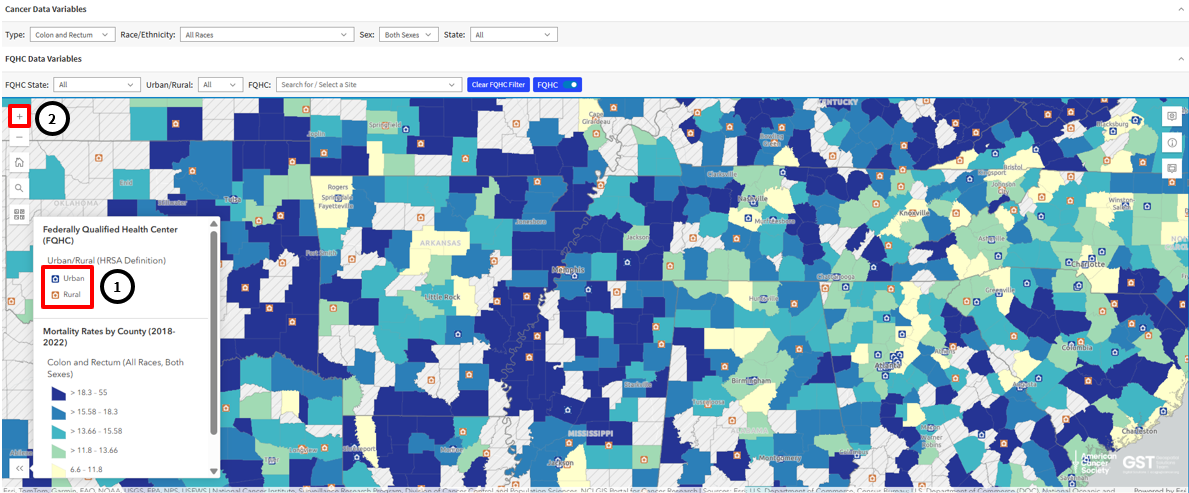
Use the (2) "+" icon to zoom in and the (3) "-" icon to zoom out.
Use the (4) docking icon to dock or undock the FQHC popup.
Use the (5) FQHC Filter option to show the FQHC sites and rates within the surrounding counties of that FQHC.
Zoomed-in view of the Atlas
Zoomed-out view of the Atlas
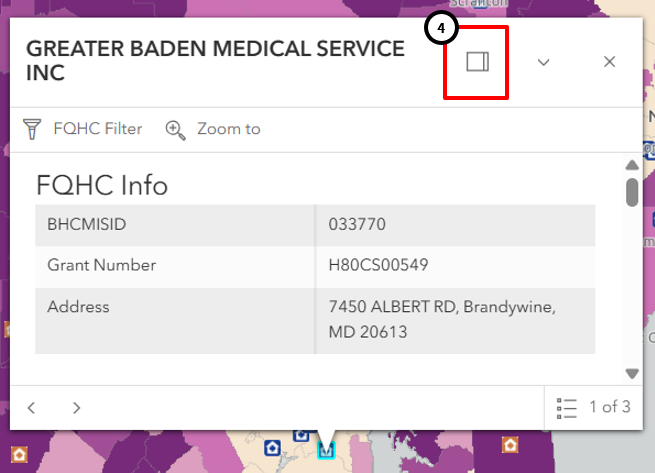
FQHC Popup Docking
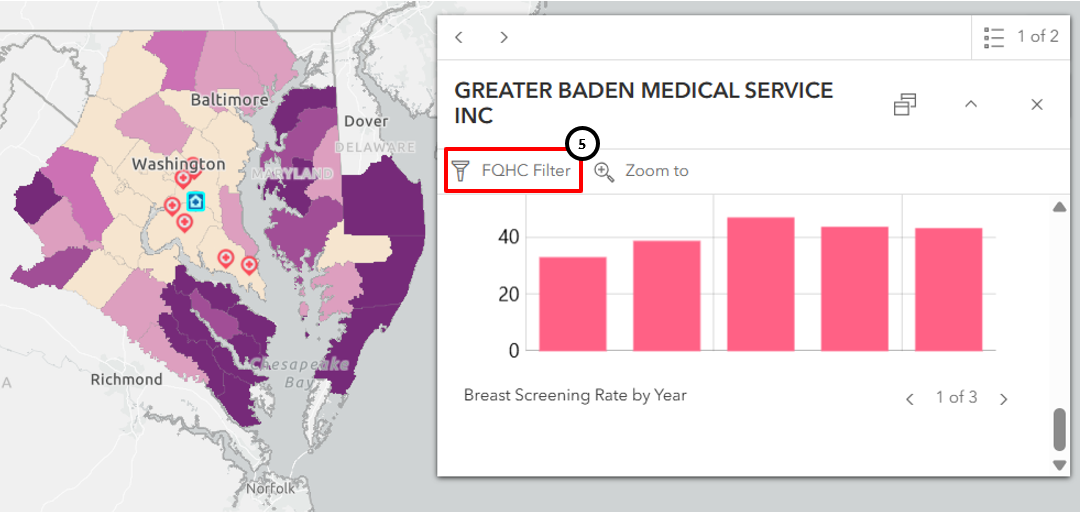
Filtering FQHC from FQHC Popup
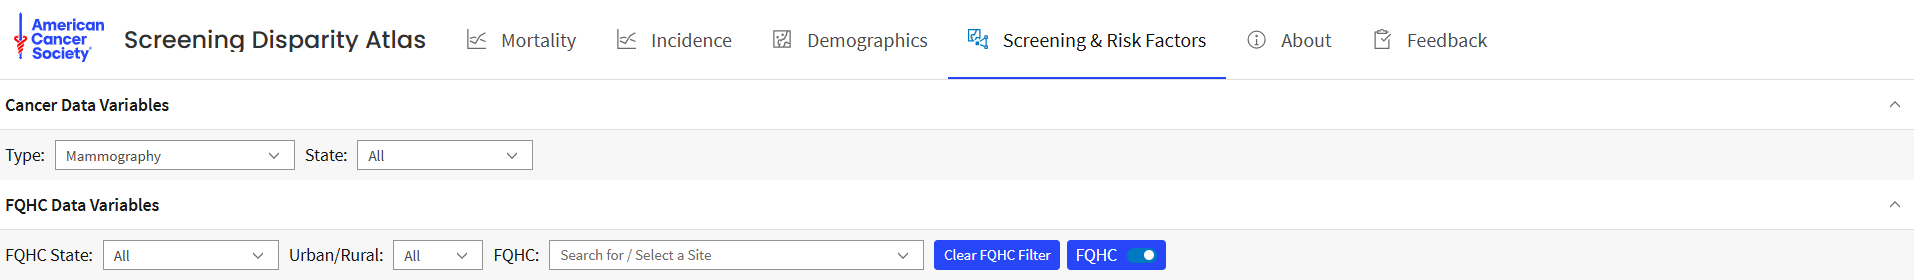
Query Panel
The query panel allows users to filter and display specific data. Each of the four maps has its own query panel in which there are slight variations:
Screening & Risk Factors Map Query Panel
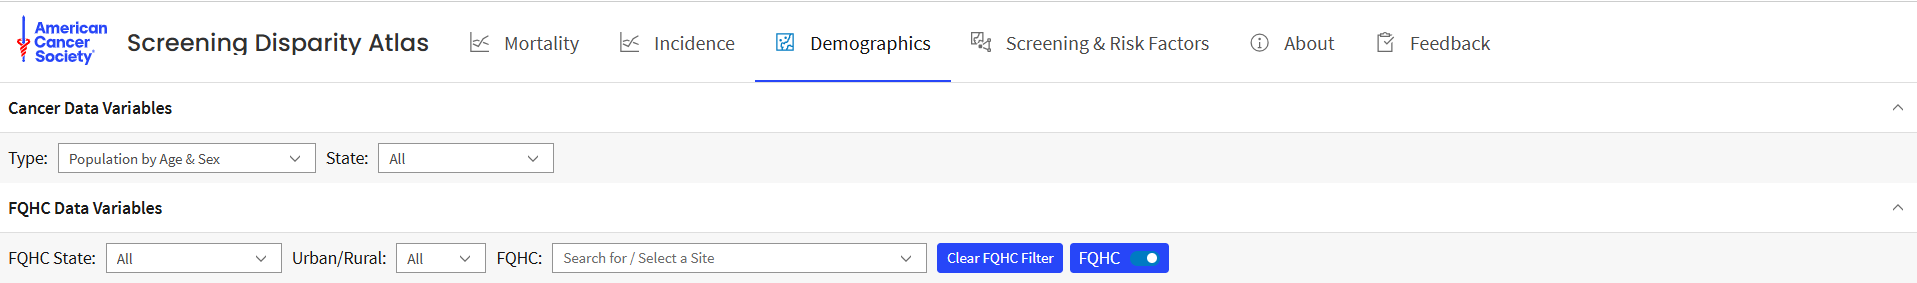
Demographics Map Query Panel
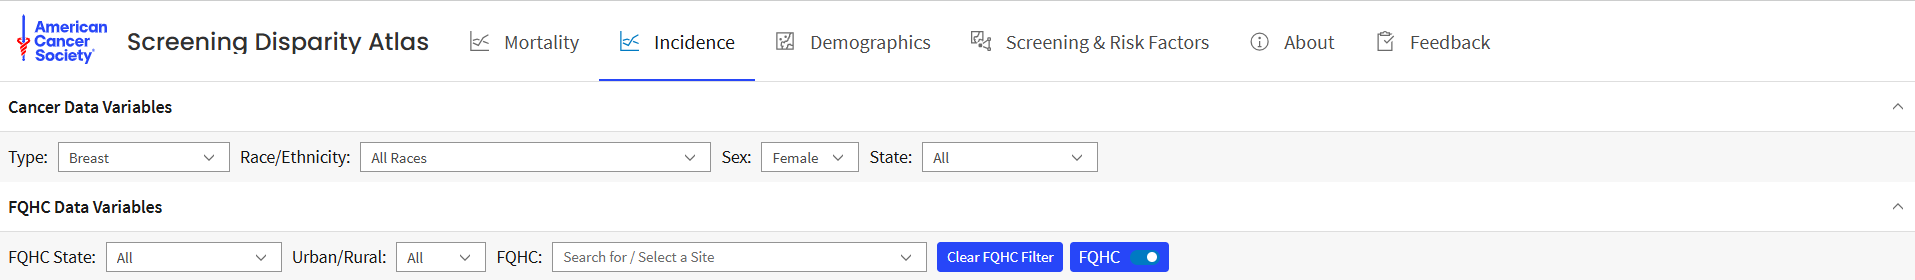
Incidence Map Query Panel
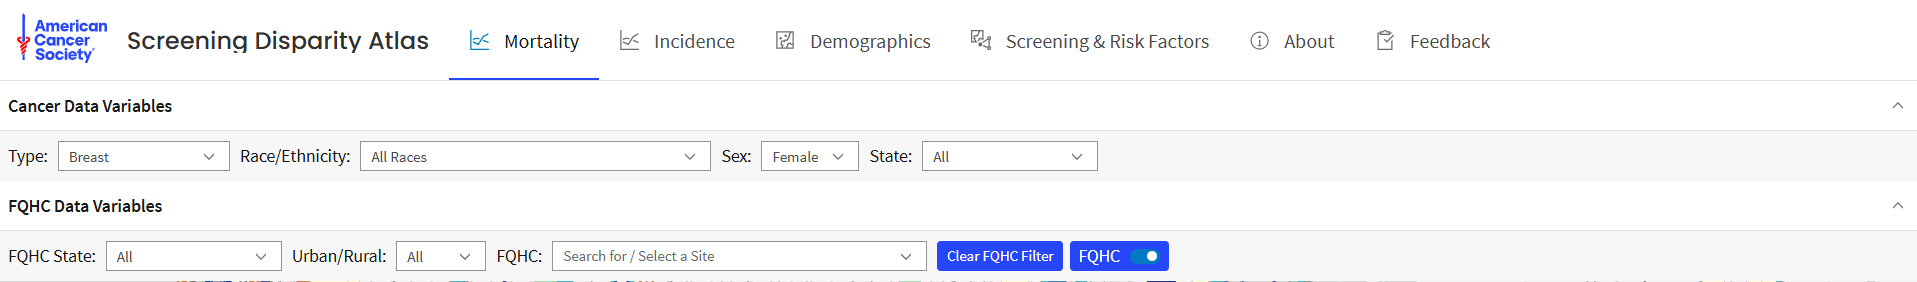
Mortality Map Query Panel
Screening & Risk Factors
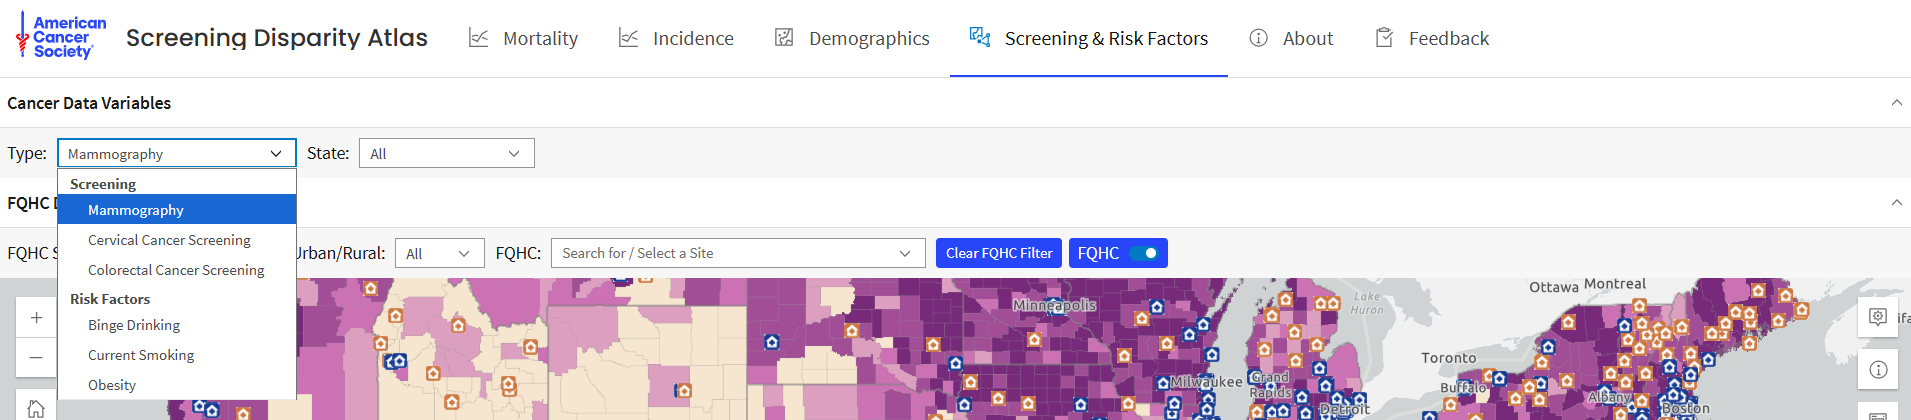
Expanded view of Screening & Risk Factors Map Query Panel
Demographics
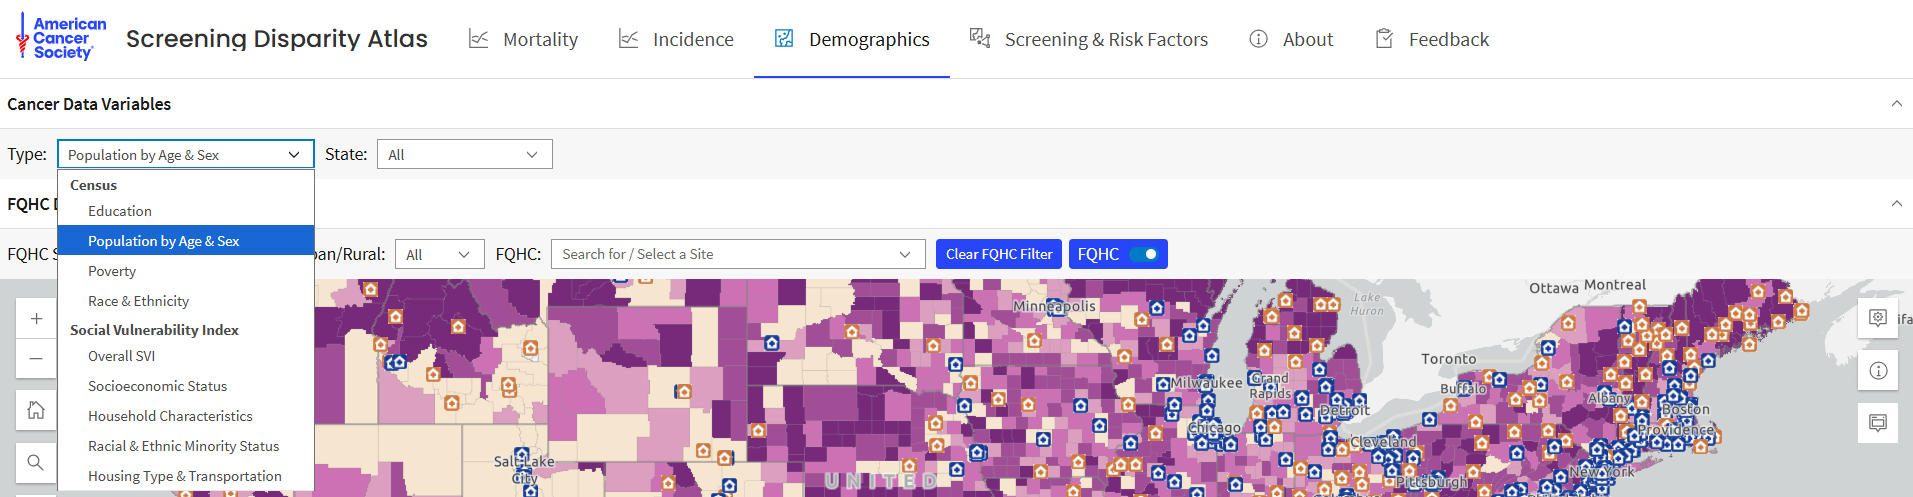
Expanded view of Demographics Map Query Panel
Incidence
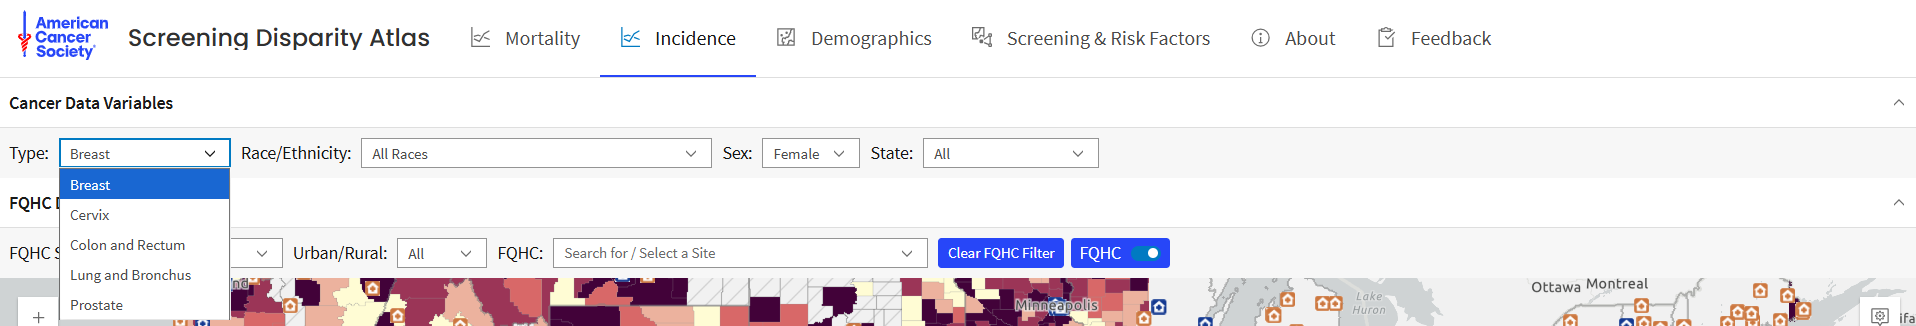
Expanded view of Incidence Map Query Panel (Cancer Type)
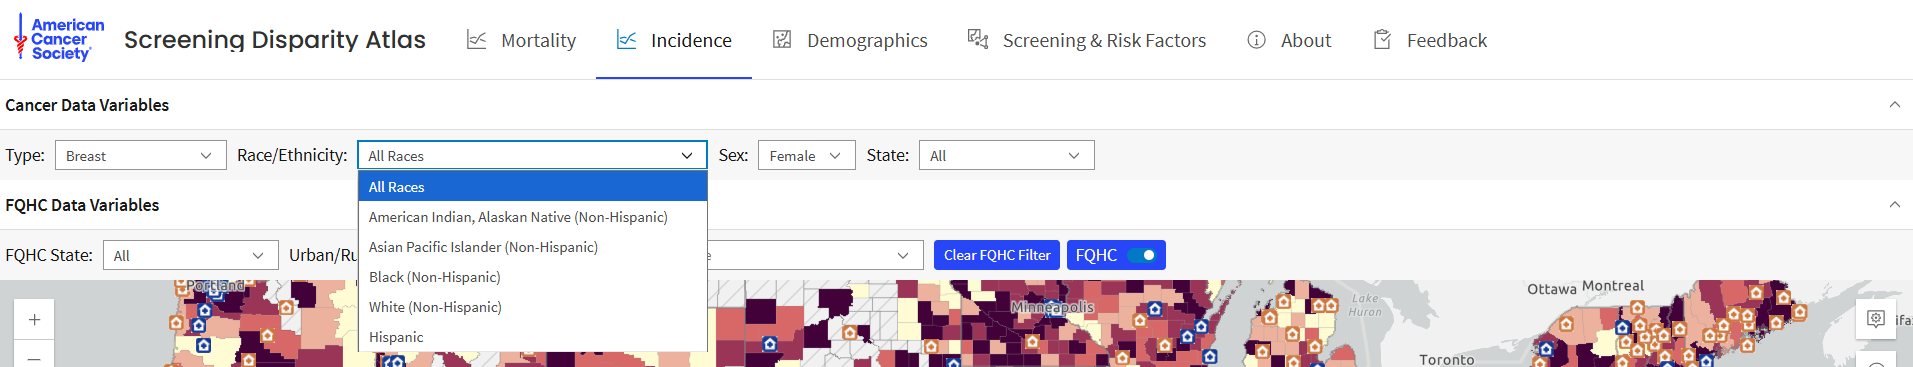
Expanded view of Incidence Map Query Panel (Race/Ethnicity)
Mortality
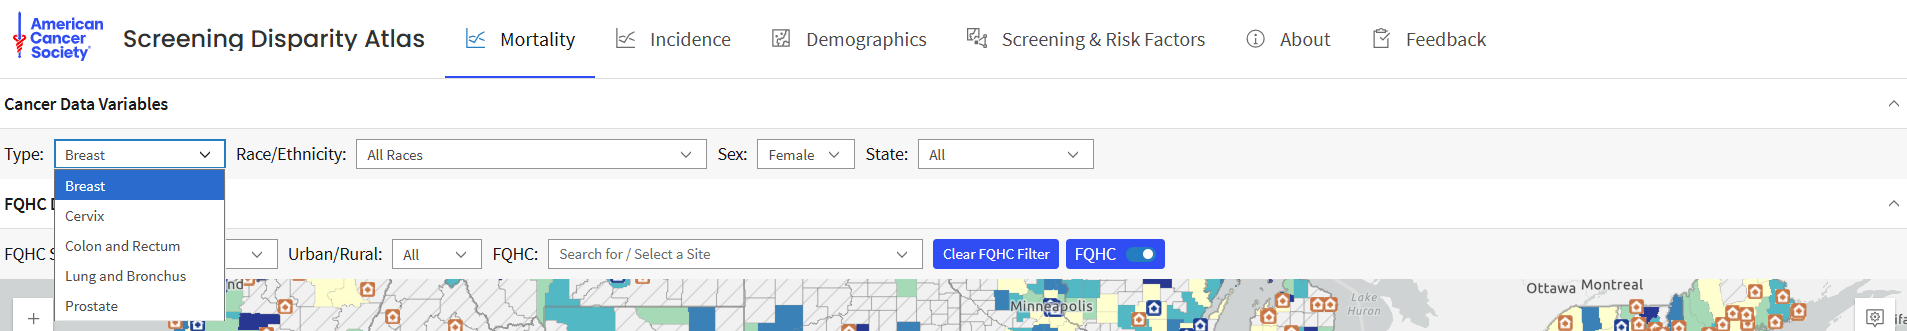
Expanded view of Mortality Map Query Panel (Cancer Type)
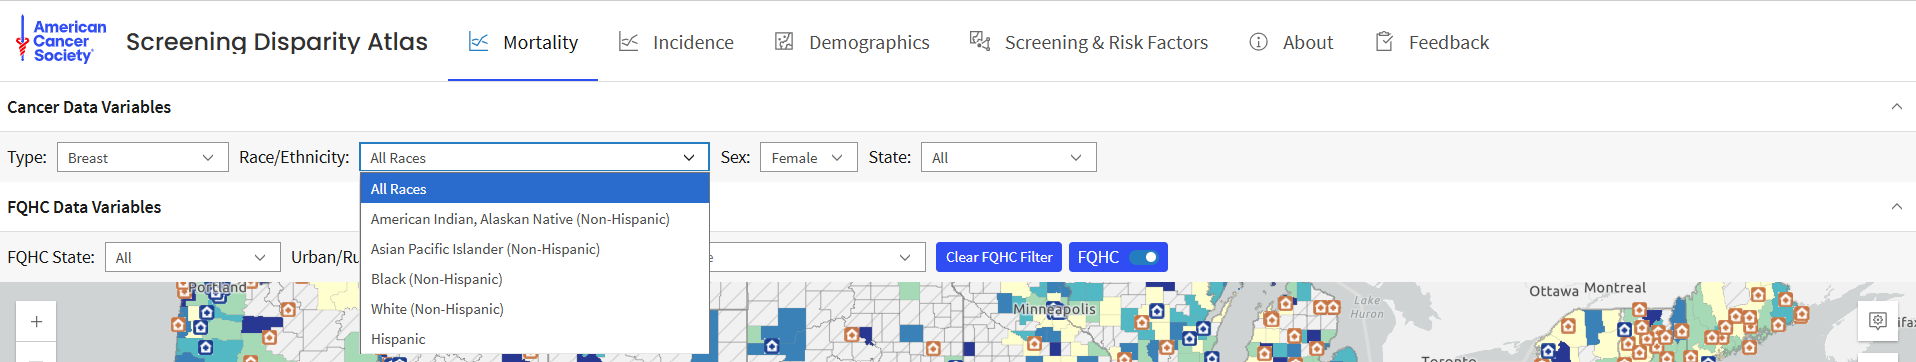
Expanded view of Mortality Map Query Panel (Race/Ethnicity)
Basemaps
The default basemap is (1) Light Gray Canvas.
Choose from thirty-three different basemaps such as (2) Community Map and (3) Outdoor.
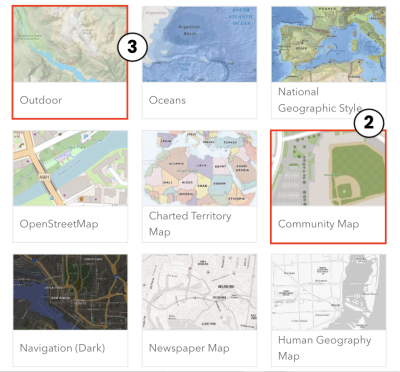
Basemap options (1/3)
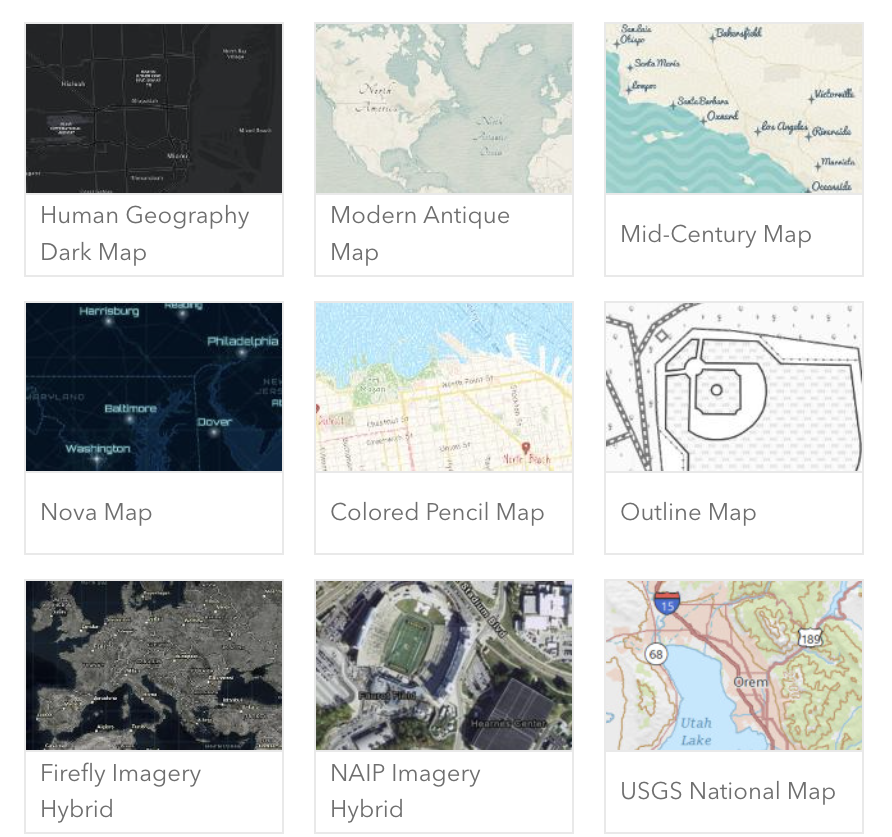
Basemap options (2/3)
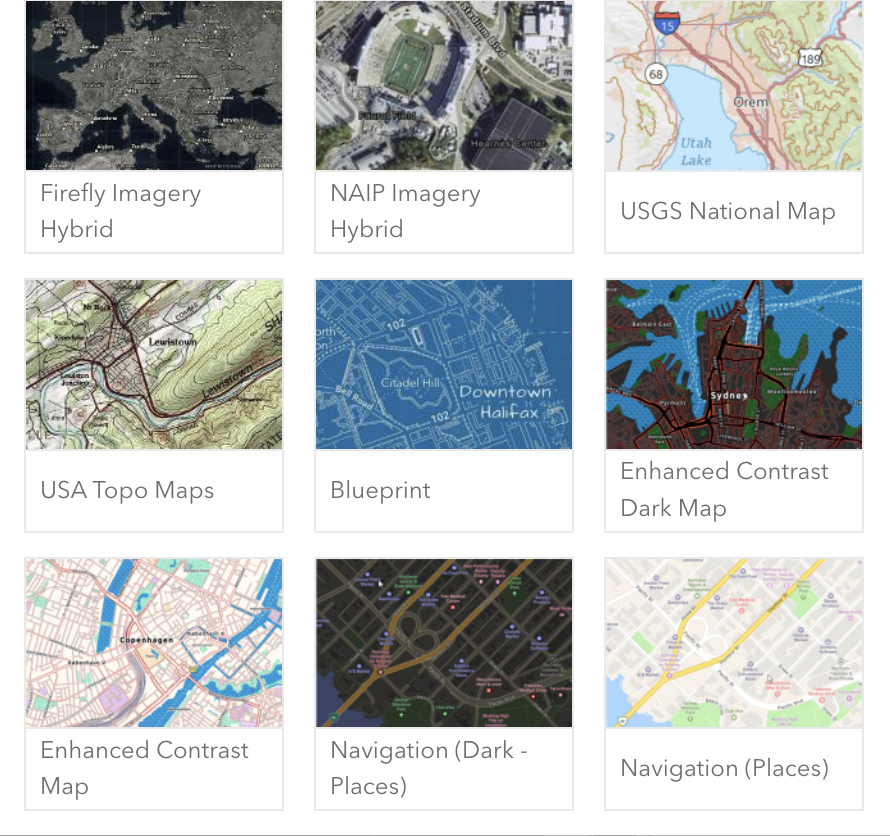
Basemap options (3/3)
Simply click on the basemap you wish to use. Here is an example (of the OpenStreetMap):
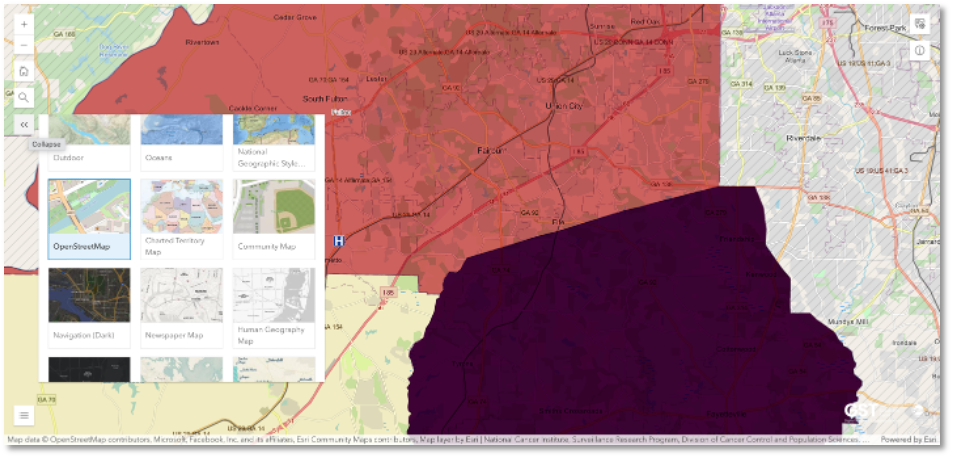
Close-up of OpenStreetMap basemap
Troubleshooting
If maps are not loading:
- Check your internet connection
- Refresh the page
- Try a different browser
For additional assistance or to leave feedback, click here.